From link.
The doc can also be invoked by texdoc tikz.
In LaTex you can use inline code, e.g., \tikz \draw (0pt,0pt) -- (20pt,6pt); to produce inline figures.
Tutorial: A Picture for Karl’s Students
1
2
3
4
5
6
7
\documentclass[tikz]{standalone}
\begin{document}
\begin{tikzpicture}
  \draw (-1.5,0) -- (1.5,0);
  \draw (0,-1.5) -- (0,1.5);
\end{tikzpicture}
\end{document}
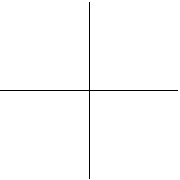
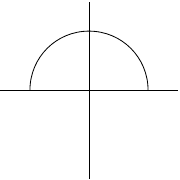
Straight Path Construction
1
\draw (-1.5,0) -- (1.5,0) -- (0,-1.5) -- (0,1.5);
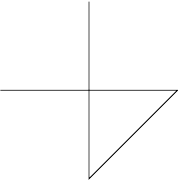
Curved Path Construction
For this, TikZ provides a special syntax. One ot two “control points” are needed. The math behind them is not quite trivial, but here is the basic idea: Suppose you are at point \(x\) and the first control point is \(y\). Then the curve will start “going in the direction of \(y\) at \(x\),” that is, the tangent of the curve at \(x\) will point toward \(y\). Next, suppose the curve should end at \(z\) and the second support point is \(w\). Then the curve will, indeed, end at \(z\) and the tangent of the curve at point \(z\) will go through \(w\).
1
2
3
4
5
6
7
\begin{tikzpicture}
  \filldraw [gray] (0,0) circle (2pt)
                   (1,1) circle (2pt)
                   (2,1) circle (2pt)
                   (2,0) circle (2pt);
  \draw (0,0) .. controls (1,1) and (2,1) .. (2,0);
\end{tikzpicture}
The general syntax for extending a path in a “curved” way is .. controls <first control point> and <second control point> .. <end point>
1
2
3
4
5
6
\begin{tikzpicture}
  \draw (-1.5,0) -- (1.5,0);
  \draw (0,-1.5) -- (0,1.5);
  \draw (-1,0) .. controls (-1,0.555) and (-0.555,1) .. (0,1)
               .. controls (0.555,1) and (1,0.555) .. (1,0);
\end{tikzpicture}
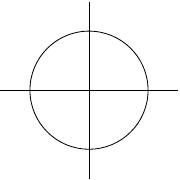
Circle Path Construction
1
\draw (0,0) circle (10pt);

1
\draw (0,0) ellipse (20pt and 10pt);

1
\draw[rotate=30] (0,0) ellipse (6pt and 3pt);

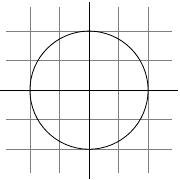
1
2
3
4
5
\begin{tikzpicture}
  \draw (-1.5,0) -- (1.5,0);
  \draw (0,-1.5) -- (0,1.5);
  \draw (0,0) circle (1cm);
\end{tikzpicture}
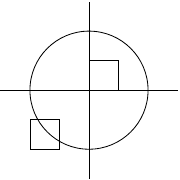
Rectangle Path Construction
1
2
3
4
5
6
7
\begin{tikzpicture}
  \draw (-1.5,0) -- (1.5,0);
  \draw (0,-1.5) -- (0,1.5);
  \draw (0,0) circle (1cm);
  \draw (0,0) rectangle (0.5,0.5);
  \draw (-0.5,-0.5) rectangle (-1,-1);
\end{tikzpicture}
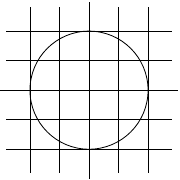
Grid Path Construction
1
\draw[step=2pt] (0,0) grid (10pt,10pt);
Note how the optional argument for \draw can be used to specify a grid width (there are also xstep and ystep to define the steppings independently).

1
2
3
4
5
6
\begin{tikzpicture}
  \draw (-1.5,0) -- (1.5,0);
  \draw (0,-1.5) -- (0,1.5);
  \draw (0,0) circle (1cm);
  \draw[step=.5cm] (-1.4,-1.4) grid (1.4,1.4);
\end{tikzpicture}
1
2
3
4
5
6
\begin{tikzpicture}
  \draw[step=.5cm,gray,very thin] (-1.4,-1.4) grid (1.4,1.4);
  \draw (-1.5,0) -- (1.5,0);
  \draw (0,-1.5) -- (0,1.5);
  \draw (0,0) circle (1cm);
\end{tikzpicture}
To subdue the grid, Karl adds two more options to the \draw command that draws the grid. First, he uses the color gray for the grid lines. Second, he reduces the line width to very thin. Finally, he swaps the ordering of the commands so that the grid is drawn first and everything else on top.
Adding a Touch of Style
Instead of the options gray, very thin Karl could also have said help lines. Styles are predefined sets of options that can be used to organize how a graphic is drawn.
1
help lines/.style={color=blue!50,very thin}
The effect of this “style setter” is that in the current scope or environment the ‘help lines’ option has the same effect as color=blue!50,very thin.
Normally, styles are defined at the beginning of a picture. However, you may sometimes wish to define a style globally, so that all pictures of your document can use this style. In this situation you can use the \tikzset command at the beginning of the document as in
1
\tikzset{help lines/.style=very thin}
To build a hierarchy of styles you can have one style use another. So in order to define a style Karl's grid that is based on the grid style Karl could say
1
2
3
\tikzset{Karl's grid/.style={help lines,color=blue!50}}
...
\draw[Karl's grid] (0,0) grid (5,5);
Styles are made even more powerful py parameterization. This means that, like other options, styles can also be used with a parameter. For instance, Karl could parameterize his grid so that, by default, it is blue, but he could also use anther color.
1
2
3
4
5
6
7
\begin{tikzpicture}
  [Karl's grid/.style ={help lines,color=#1!50},
  Karl's grid/.default=blue]

  \draw[Karl's grid]     (0,0) grid (1.5,2);
  \draw[Karl's grid=red] (2,0) grid (3.5,2);
\end{tikzpicture}
Drawing Options
There are many options simiar to
1
\draw[step=.5cm,gray,very thin] (-1.4,-1.4) grid (1.4,1.4);
ultra thin, very thin, thin, semithick, thick, very thick, ultra thick, where thin is the default thickness.
Another useful thing is dashed and dotted. And also lossely dashed, densely dashed, loosely dotted, densely dotted.
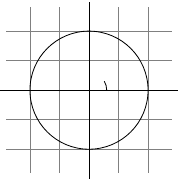
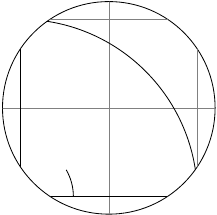
Arc Path Construction
1
2
3
4
5
6
7
\begin{tikzpicture}
  \draw[step=.5cm,gray,very thin] (-1.4,-1.4) grid (1.4,1.4);
  \draw (-1.5,0) -- (1.5,0);
  \draw (0,-1.5) -- (0,1.5);
  \draw (0,0) circle [radius=1cm];
  \draw (3mm,0mm) arc [start angle=0, end angle=30, radius=3mm];
\end{tikzpicture}
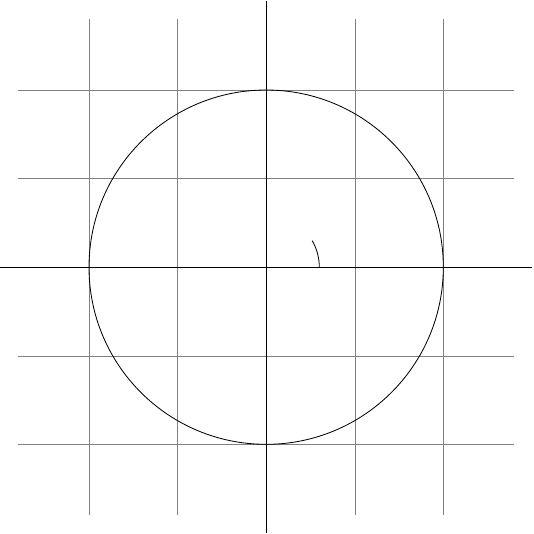
1
2
3
4
5
6
7
\begin{tikzpicture}[scale=3]
\draw[step=.5cm,gray,very thin] (-1.4,-1.4) grid (1.4,1.4);
\draw (-1.5,0) -- (1.5,0);
\draw (0,-1.5) -- (0,1.5);
\draw (0,0) circle [radius=1cm];
\draw (3mm,0mm) arc [start angle=0, end angle=30, radius=3mm];
\end{tikzpicture}
Clipping a Path
1
2
3
4
5
6
7
8
\begin{tikzpicture}[scale=3]
  \clip (-0.1,-0.2) rectangle (1.1,0.75);
  \draw[step=.5cm,gray,very thin] (-1.4,-1.4) grid (1.4,1.4);
  \draw (-1.5,0) -- (1.5,0);
  \draw (0,-1.5) -- (0,1.5);
  \draw (0,0) circle [radius=1cm];
  \draw (3mm,0mm) arc [start angle=0, end angle=30, radius=3mm];
\end{tikzpicture}
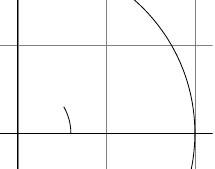
You can also do both at the same time: Draw and clip a path. For this, use the \draw command and add the clip option. (This is not the whole pecture: You can also use the \clip command and add the draw option. Well, that is also not the whole picture: In reality, \draw is just a shorthand for \path[draw] and \clip is a shorthand for \path[clip] and you could also say \path[draw,clip].) Here is an example:
1
2
3
4
5
6
7
8
\begin{tikzpicture}[scale=3]
  \clip[draw] (0.5,0.5) circle (.6cm);
  \draw[step=.5cm,gray,very thin] (-1.4,-1.4) grid (1.4,1.4);
  \draw (-1.5,0) -- (1.5,0);
  \draw (0,-1.5) -- (0,1.5);
  \draw (0,0) circle [radius=1cm];
  \draw (3mm,0mm) arc [start angle=0, end angle=30, radius=3mm];
\end{tikzpicture}
Parabola and Sine Path Construction
1
\draw (0,0) rectangle (1,1) (0,0) parabola (1,1);

It is also possible to place the bend somewhere else:
1
\draw[x=1pt,y=1pt] (0,0) parabola bend (4,16) (6,12);

The operations sin and cos add a sine or cosine curve in the interval \([0,\pi/2]\) such that the previous current point is at the start of the curve and the curve ends at the given end point.
1
2
\draw[x=1.57ex,y=1ex] (0,0) sin (1,1) cos (2,0) sin (3,-1) cos (4,0)
                      (0,1) cos (1,0) sin (2,-1) cos (3,0) sin (4,1);

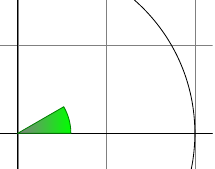
Filling and Drawing
1
2
3
4
5
6
7
8
9
\begin{tikzpicture}[scale=3]
\clip (-0.1,-0.2) rectangle (1.1,0.75);
\draw[step=.5cm,gray,very thin] (-1.4,-1.4) grid (1.4,1.4);
\draw (-1.5,0) -- (1.5,0);
\draw (0,-1.5) -- (0,1.5);
\draw (0,0) circle [radius=1cm];
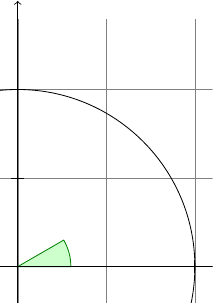
\fill[green!20!white] (0,0) -- (3mm,0mm)
arc [start angle=0, end angle=30, radius=3mm] -- (0,0);
\end{tikzpicture}
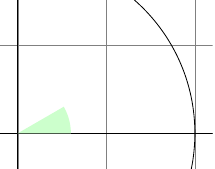
The color green!20!white means 20% green and 80% white mixed together. Such color expression are possible since TikZ uses Uwe Kern’s xcolor package, see the documentation of that package for details on color expressions.
What would have happened, if Karl had not “closed” the path using --(0,0) at the end? In this case, the path is closed automatically, so this could have been omitted. Indeed, it would even have been better to write the following, instead:
1
2
\fill[green!20!white] (0,0) -- (3mm,0mm)
  arc [start angle=0, end angle=30, radius=3mm] -- cycle;
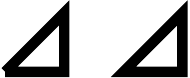
The --cycle causes the current path to be closed (actually the current part of the current path) by smoothly joining the first and last point. To appreciate the difference, consider the following example:
1
2
3
4
5
\begin{tikzpicture}[line width=5pt]
  \draw (0,0) -- (1,0) -- (1,1) -- (0,0);
  \draw (2,0) -- (3,0) -- (3,1) -- cycle;
  \useasboundingbox (0,1.5); % make bounding box higher
\end{tikzpicture}
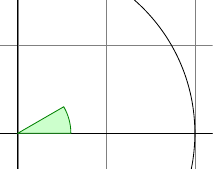
You can also fill and draw a path at the same time using the \filldraw command. You can speficy different colors to be used for filling and for stroking.
1
2
3
4
5
6
7
8
9
\begin{tikzpicture}[scale=3]
  \clip (-0.1,-0.2) rectangle (1.1,0.75);
  \draw[step=.5cm,gray,very thin] (-1.4,-1.4) grid (1.4,1.4);
  \draw (-1.5,0) -- (1.5,0);
  \draw (0,-1.5) -- (0,1.5);
  \draw (0,0) circle [radius=1cm];
  \filldraw[fill=green!20!white, draw=green!50!black] (0,0) -- (3mm,0mm)
    arc [start angle=0, end angle=30, radius=3mm] -- cycle;
\end{tikzpicture}
Shading
1
\shade (0,0) rectangle (2,1) (3,0.5) circle (.5cm);

The default shading is a smooth transition from gray to white. To specify different colors, you can use options:
1
2
3
4
5
6
\begin{tikzpicture}[rounded corners,ultra thick]
  \shade[top color=yellow,bottom color=black] (0,0) rectangle +(2,1);
  \shade[left color=yellow,right color=black] (3,0) rectangle +(2,1);
  \shadedraw[inner color=yellow,outer color=black,draw=yellow] (6,0) rectangle +(2,1);
  \shade[ball color=green] (9,.5) circle (.5cm);
\end{tikzpicture}

1
2
3
4
5
6
7
8
9
10
\begin{tikzpicture}[scale=3]
  \clip (-0.1,-0.2) rectangle (1.1,0.75);
  \draw[step=.5cm,gray,very thin] (-1.4,-1.4) grid (1.4,1.4);
  \draw (-1.5,0) -- (1.5,0);
  \draw (0,-1.5) -- (0,1.5);
  \draw (0,0) circle [radius=1cm];
  \shadedraw[left color=gray,right color=green, draw=green!50!black]
  (0,0) -- (3mm,0mm)
    arc [start angle=0, end angle=30, radius=3mm] -- cycle;
\end{tikzpicture}
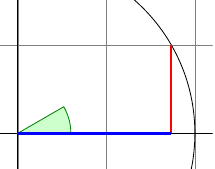
Specifying Coordinates
There are different ways of specifying coordinates. The easiest way is to say something like (10pt,2cm). This means 10pt in \(x\)-direction and 2cm in \(y\)-directions. Alternatively, you can also leave out the units as in (1,2), which means “one times the current \(x\)-vector pule twice the current \(y\)-vector”. These vectors default to 1cm.
(30:1cm)means 1cm in direction 30 degree.+(0cm,1cm)means “1cm upwards from the previous speficied position”.++(2cm,0cm)means “2cm to the right of the previous specified position, making this the new specified position”.
1
2
3
4
5
6
7
8
9
10
\begin{tikzpicture}[scale=3]
  \clip (-0.1,-0.2) rectangle (1.1,0.75);
  \draw[step=.5cm,gray,very thin] (-1.4,-1.4) grid (1.4,1.4);
  \draw (-1.5,0) -- (1.5,0);
  \draw (0,-1.5) -- (0,1.5);
  \draw (0,0) circle [radius=1cm];
  \shadedraw[left color=gray,right color=green, draw=green!50!black]
  (0,0) -- (3mm,0mm)
    arc [start angle=0, end angle=30, radius=3mm] -- cycle;
\end{tikzpicture}
1
2
3
4
5
6
7
8
9
10
\begin{tikzpicture}[scale=3]
  \clip (-0.1,-0.2) rectangle (1.1,0.75);
  \draw[step=.5cm,gray,very thin] (-1.4,-1.4) grid (1.4,1.4);
  \draw (-1.5,0) -- (1.5,0);
  \draw (0,-1.5) -- (0,1.5);
  \draw (0,0) circle [radius=1cm];
  \filldraw[fill=green!20,draw=green!50!black] (0,0) -- (3mm,0mm)
    arc [start angle=0, end angle=30, radius=3mm] -- cycle;
  \draw[red,very thick] (30:1cm) -- +(0,-0.5);
\end{tikzpicture}
(30:1cm |- 0,0)means “the point straight down from(30:1cm)that lies on the \(x\)-axis”.(<p> |- <q>)means “the intersection of a vertical line through \(p\) and a horizontal line through \(q\)”.
1
2
3
4
5
6
7
8
9
10
11
\begin{tikzpicture}[scale=3]
  \clip (-0.1,-0.2) rectangle (1.1,0.75);
  \draw[step=.5cm,gray,very thin] (-1.4,-1.4) grid (1.4,1.4);
  \draw (-1.5,0) -- (1.5,0);
  \draw (0,-1.5) -- (0,1.5);
  \draw (0,0) circle [radius=1cm];
  \filldraw[fill=green!20,draw=green!50!black] (0,0) -- (3mm,0mm)
    arc [start angle=0, end angle=30, radius=3mm] -- cycle;
  \draw[red,very thick] (30:1cm) -- +(0,-0.5);
  \draw[blue,very thick] (30:1cm) ++(0,-0.5) -- (0,0);
\end{tikzpicture}
To appreciate the difference between + and ++ consider the following example
1
2
3
4
5
6
7
8
9
10
11
12
13
% Example using ++
\begin{tikzpicture}
  \def\rectanglepath{-- ++(1cm,0cm) -- ++(0cm,1cm) -- ++(-1cm,0cm) -- cycle}
  \draw (0,0) \rectanglepath;
  \draw (1.5,0) \rectanglepath;
\end{tikzpicture}

% Example using +
\begin{tikzpicture}
  \def\rectanglepath{-- +(1cm,0cm) -- +(1cm,1cm) -- +(0cm,1cm) -- cycle}
  \draw (0,0) \rectanglepath;
  \draw (1.5,0) \rectanglepath;
\end{tikzpicture}
all of this could have been written as
1
\draw (0,0) rectangle +(1,1) (1.5,0) rectangle +(1,1);
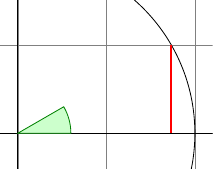
Intersecting Paths
(1,{tan(30)}): TikZ’s math engine knows how to compute things liketan(30). Note the added braces since, otherwise, TikZ’s parser would think that the first closing parenthesis ends the coordinate (in general, you need to add braces around components of coordinates when these components contain parentheses).\pathcommand without any options likedraworfillcreates “invisible” path.
1
2
3
4
5
6
\path [name path=upward line] (1,0) -- (1,1);
\path [name path=sloped line] (0,0) -- (30:1.5cm); % a bit longer, so that there is an intersection

% (add `\usetikzlibrary{intersections}' after loading tikz in the preamble)
\draw [name intersections={of=upward line and sloped line, by=x}]
  [very thick,orange] (1,0) -- (x);
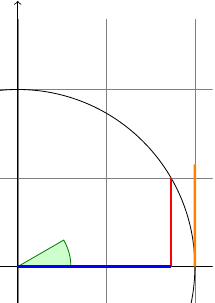
Adding Arrow Tips
- Adds the option
->to the drawing commands. ->puts arrow tips at the end of the path.<-puts arrow tips at the begining of the path.<->puts arrow tips at both ends of the path.
1
2
3
4
5
6
7
8
9
10
11
12
13
14
15
16
17
18
\usetikzlibrary {intersections}
\begin{tikzpicture}[scale=3]
  \clip (-0.1,-0.2) rectangle (1.1,1.51);
  \draw[step=.5cm,gray,very thin] (-1.4,-1.4) grid (1.4,1.4);
  \draw[->] (-1.5,0) -- (1.5,0);
  \draw[->] (0,-1.5) -- (0,1.5);
  \draw (0,0) circle [radius=1cm];
  \filldraw[fill=green!20,draw=green!50!black] (0,0) -- (3mm,0mm)
    arc [start angle=0, end angle=30, radius=3mm] -- cycle;
  \draw[red,very thick]
  (30:1cm) -- +(0,-0.5);
  \draw[blue,very thick]
  (30:1cm) ++(0,-0.5) -- (0,0);
  \path [name path=upward line] (1,0) -- (1,1);
  \path [name path=sloped line] (0,0) -- (30:1.5cm);
  \draw [name intersections={of=upward line and sloped line, by=x}]
  [very thick,orange] (1,0) -- (x);
\end{tikzpicture}
- You canadd arrow tips only to a sinle open “line”. For example, you cannot add tips to, say, a rectangle or circuit. However, you can add arrow tips to curved paths and to paths that have several segments.
1
2
3
4
\begin{tikzpicture}
  \draw [<->] (0,0) arc [start angle=180, end angle=30, radius=10pt];
  \draw [<->] (1,0) -- (1.5cm,10pt) -- (2cm,0pt) -- (2.5cm,10pt);
\end{tikzpicture}
- There are different arrow styles. (see section 106.)
1
2
3
4
5
\usetikzlibrary {arrows.meta}
\begin{tikzpicture}[>=Stealth]
  \draw [->] (0,0) arc [start angle=180, end angle=30, radius=10pt];
  \draw [<<-,very thick] (1,0) -- (1.5cm,10pt) -- (2cm,0pt) -- (2.5cm,10pt);
\end{tikzpicture}

Scoping
1
2
3
4
5
6
7
8
\begin{tikzpicture}[ultra thick]
  \draw (0,0) -- (0,1);
  \begin{scope}[thin]
    \draw (1,0) -- (1,1);
    \draw (2,0) -- (2,1);
  \end{scope}
  \draw (3,0) -- (3,1);
\end{tikzpicture}
- Scoping has another interesing effect: Any changes to the clipping area are local to the scope.
Transformations
- TikZ provides numerous options that allow you to transform coordinates.
- For example, the
xshiftoption allows you to shift all subsequent points by certain amount.
1
\draw (0,0) -- (0,0.5) [xshift=2pt] (0,0) -- (0,0.5);

- You can change transformation “in the middle of a path”
1
2
3
4
5
\begin{tikzpicture}[even odd rule,rounded corners=2pt,x=10pt,y=10pt]
  \filldraw[fill=yellow!80!black] (0,0) rectangle (1,1)
          [xshift=5pt,yshift=5pt] (0,0) rectangle (1,1)
                      [rotate=30] (-1,-1) rectangle (2,2);
\end{tikzpicture}

Repeating Things: For-Loops
1
\foreach \x in {1,2,3} {$x=\x$,}
The general syntax is \foreach <variable> in { <list of values> } <commands>. If the <commands> do not start with a brace, everyhing up to the next semicolon is used as <commands>.
1
2
3
4
5
6
7
8
9
10
11
12
13
\begin{tikzpicture}[scale=3]
  \clip (-0.1,-0.2) rectangle (1.1,1.51);
  \draw[step=.5cm,gray,very thin] (-1.4,-1.4) grid (1.4,1.4);
  \filldraw[fill=green!20,draw=green!50!black] (0,0) -- (3mm,0mm)
  arc [start angle=0, end angle=30, radius=3mm] -- cycle;
  \draw[->] (-1.5,0) -- (1.5,0);
  \draw[->] (0,-1.5) -- (0,1.5);
  \draw (0,0) circle [radius=1cm];
  \foreach \x in {-1cm,-0.5cm,1cm}
    \draw (\x,-1pt) -- (\x,1pt);
  \foreach \y in {-1cm,-0.5cm,0.5cm,1cm}
    \draw (-1pt,\y) -- (1pt,\y);
\end{tikzpicture}
1
2
\foreach \x in {-1,-0.5,1}
  \draw[xshift=\x cm] (0pt,-1pt) -- (0pt,1pt);
1
2
\tikz \foreach \x in {1,...,10}
  \draw (\x,0) circle (0.4cm);
1
2
\tikz \foreach \x in {-1,-0.5,...,1}
  \draw (\x cm,-1pt) -- (\x cm,1pt);
1
2
3
4
5
6
7
8
\begin{tikzpicture}
\foreach \x in {1,2,...,5,7,8,...,12}
  \foreach \y in {1,...,5}
  {
    \draw (\x,\y) +(-.5,-.5) rectangle ++(.5,.5);
    \draw (\x,\y) node{\x,\y};
  }
\end{tikzpicture}
Adding Text